The iOS application "Dataglobe" available for free from the app-store, is a small data-visualization project developed in collaboration with Hans Jákup Danielsen and the Global Sustainability Institute.
The (uneven) distribution of natural resources greatly affects geopolitical stability, and future global prosperity.
This series of 9 data visualizations seeks to tell a clear story, with data composited on the following topics at three snapshots: 2000, 2005 and 2010.
XXXX 1. Freshwater withdrawals
Renewable water resources, minus water consumption pr country.
The visualization indicates lack off freshwater "self-sufficiency" (low water availability).
Source: Food and Agriculture Organization, AQUASTAT data.
Consumption, Annual available renewable water
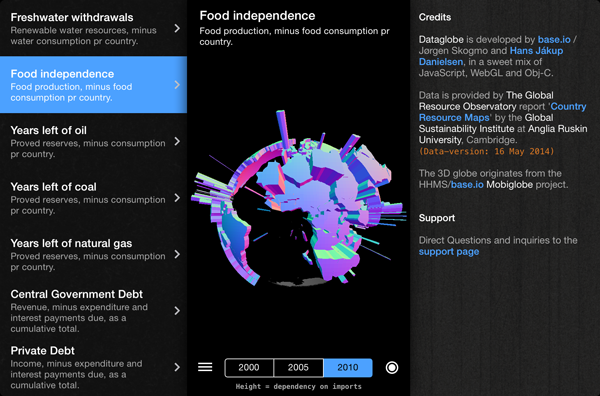
2. Food independence
Food production, minus food consumption pr country.
The visualization indicates dependency on imports.
Source: Food and Agriculture Organisation Statistics Department (FAOSTAT).
Consumption, Annual available production
3. Oil
Proved reserves, minus consumption pr country.
The visualization indicates years left (at the current consumption rate).
Source: EIA (Energy Information Administration) International Energy Statistics:
Consumption, Reserves
4. Coal
Proved reserves, minus consumption pr country.
The visualization indicates years left (at the current consumption rate).
Source: BP Statistical Yearbook data:
Consumption, [Reserves](http://www.bp.com/en/global/corporate/about-bp/energy-economics/statistical-review-of-world- energy-2013.html)
5. Natural Gas
Proved reserves, minus consumption pr country.
The visualization indicates years left (at the current consumption rate).
Source: EIA (Energy Information Administration) International Energy Statistics:
Consumption, Reserves
6. Central Government Debt
Revenue, minus expenditure and interest payments due, as a cumulative total.
The visualization indicates Debt in % of GDP.
Source: International Monetary Fund, Government Finance Statistics Yearbook and data files, and World Bank and OECD GDP estimates.
Debt, GDP
7. Private Debt
Income, minus expenditure and interest payments due, as a cumulative total.
The visualization indicates Debt in % of GDP.
["Private" is defined here as companies, households, and non-profit institutions; Financial instiutions (such as banks) is excluded.]
Source: OECD. Original data are compiled and provided either by Central Banks, or Ministries of Finance of National Statistical Offices. The OECD Secretariat uses these original data to calculate the financial indicators.
Debt, GDP
8. Under-5 Mortality
Social development standards (such as water supply, sanitation, medical care, housing conditions, and literacy) as indicated by the under-5 mortality rates.
The visualization indicates probability per thousand.
Source: Estimates developed by the UN Inter-agency Group for Child Mortality Estimation (UNICEF, WHO, World Bank, UN DESA Population Division).
Mortality data
9. Income inequality
Income distribution accross the population.
The visualization indicates inequality.
Source: World Bank, Development Research Group. Data are based on primary household survey data obtained from government statistical agencies and World Bank country departments. Data for high-income economies are from the Luxembourg Income Study database. For more information and methodology, please see PovcalNet.
Income data
Data is provided by 'The Global Resource Observatory' report Country Resource Maps by the Global Sustainability Institute at Anglia Ruskin University, Cambridge. (Data-version: 16 May 2014)
A earlier version of the data was mentioned on The Verge
The application uses the Ejecta project for rendering the wonderfull 3d globe (originating from mobiglobe) with WebGL, Jesse Andersen's great JASidePanelController and Fuerte International's brilliant FTCoreText library.
Hans Jákup worked primarily with data parsing while I coded the app.
The UI was designed together.